Quantifying and Modeling Perceptual Variability
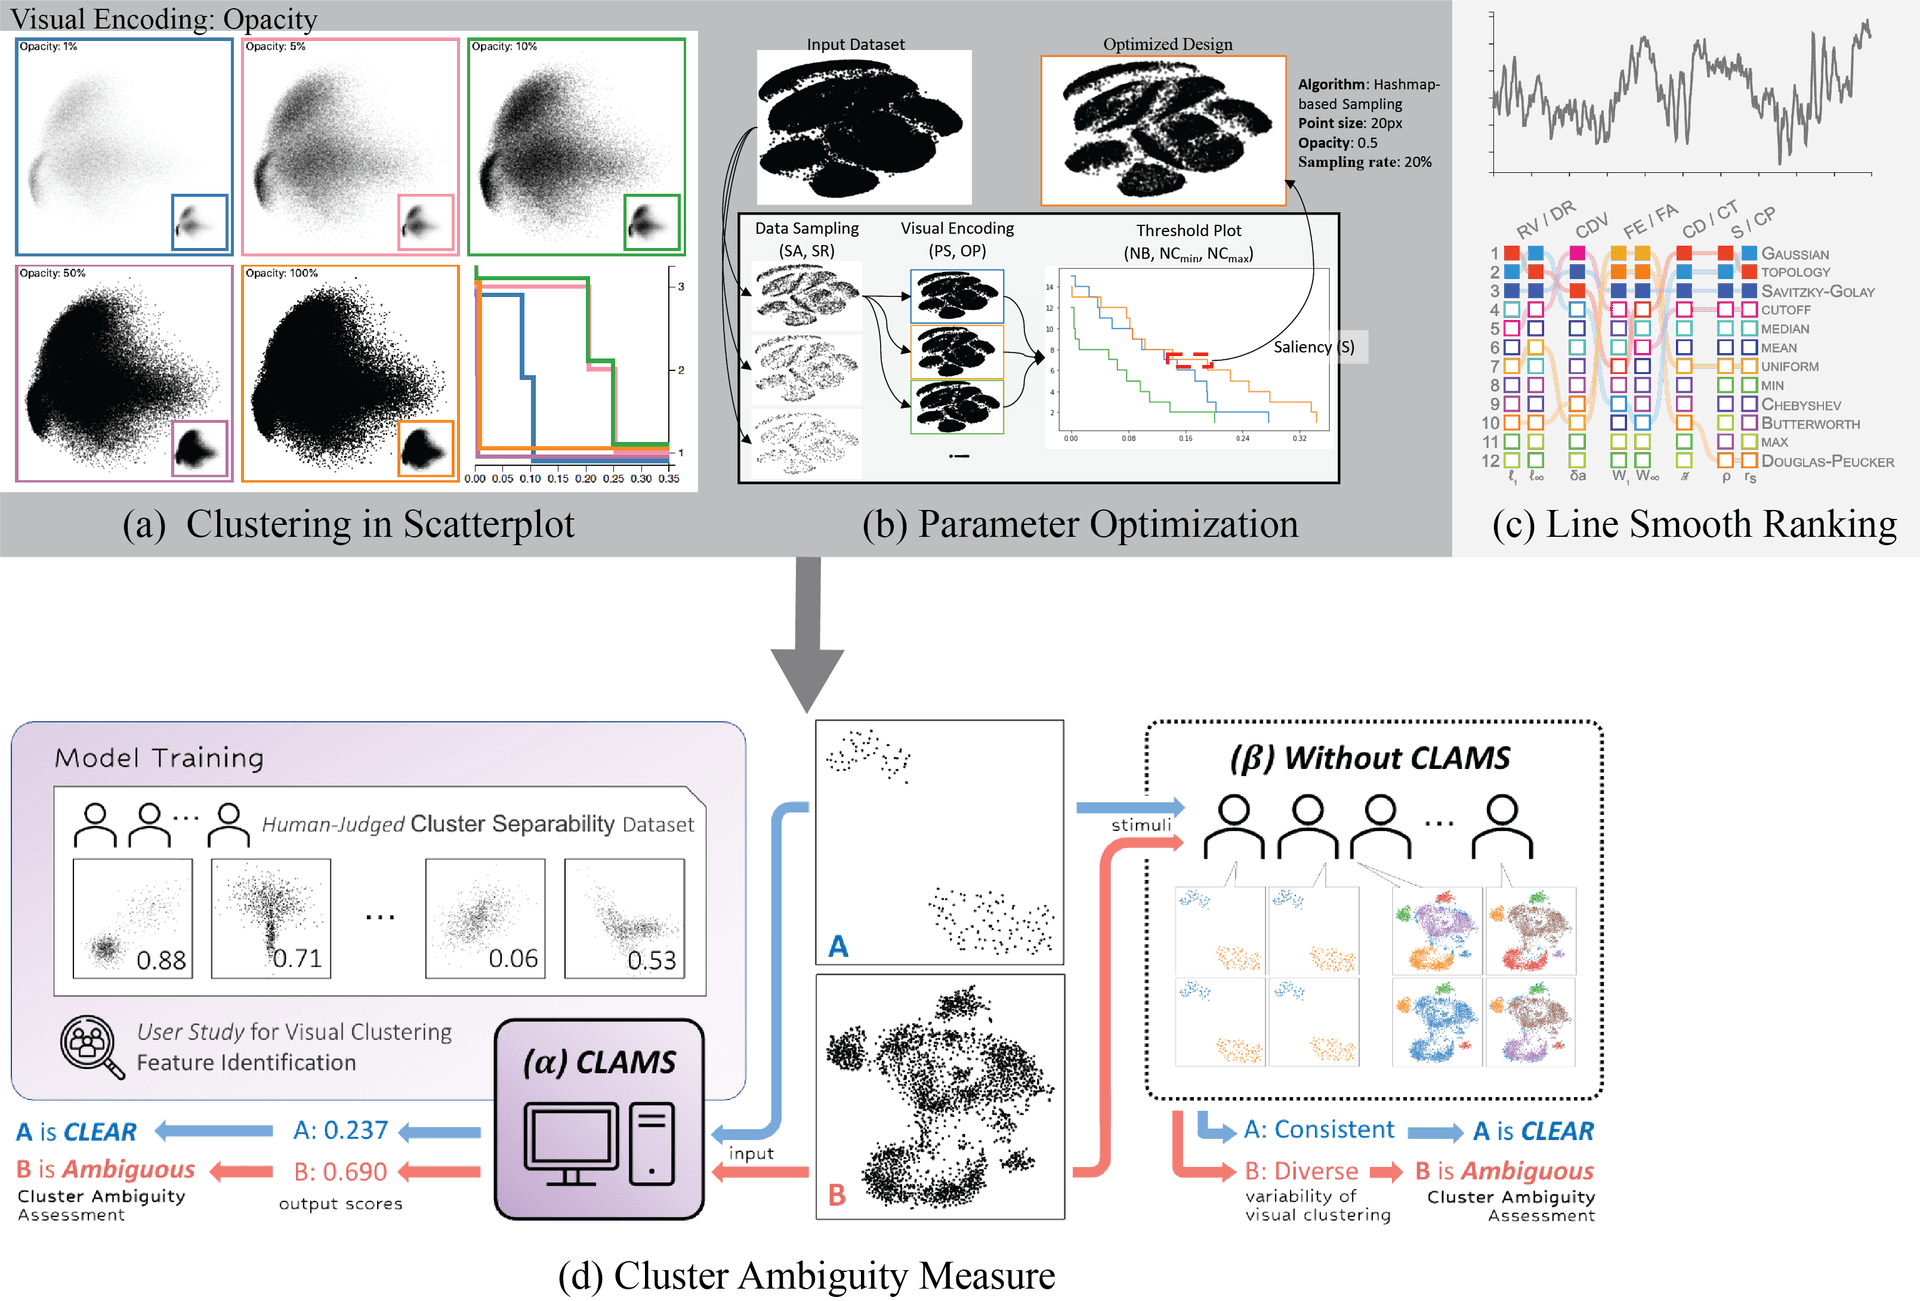
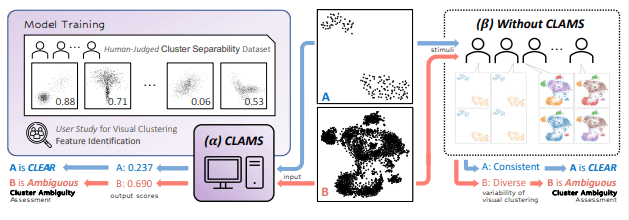
How do we perceive complex visual information? Is this perception consistent across individuals? What factors shape these differences, and can we quantify them? To address the limitations of human visual perception in data visualization, computational metrics and models offer a path forward. By objectively measuring variability in interpretation (e.g., through cluster separability or other perceptual characteristics), researchers can systematically optimize visualizations for reliability and efficiency.
Related Papers
High Level Visual Comprehension
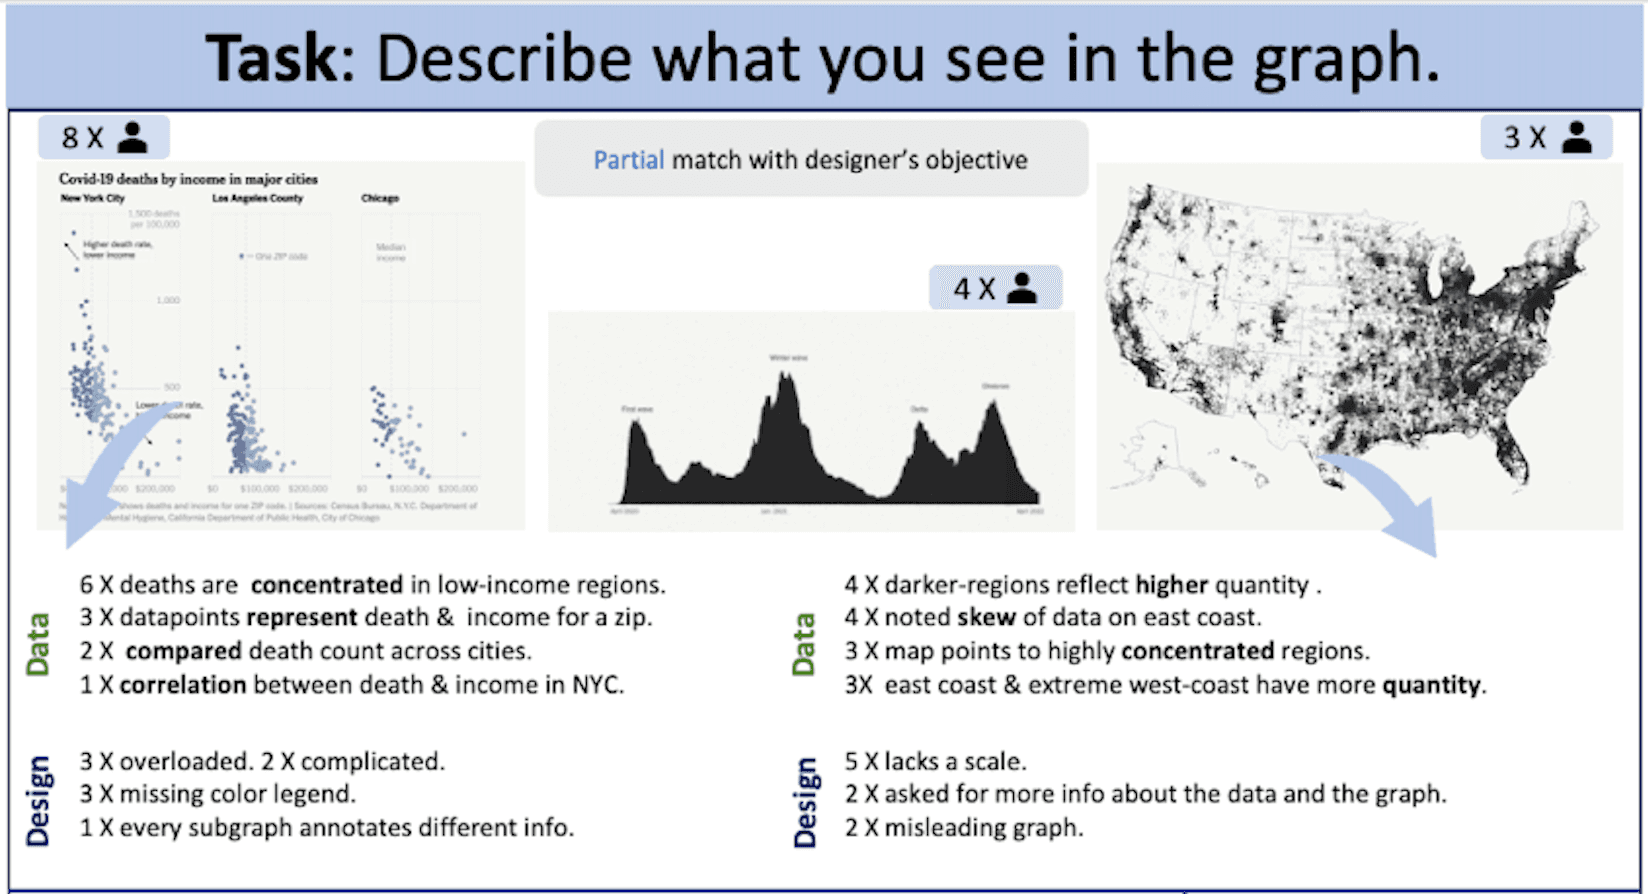
High-level Visual comprehension describes the overall knowledge a viewer intuitively gains about the data without explicit cueing or guidance. Our work investigates the high-level patterns people naturally see when encountering a visualization without a guiding task. People's interpretations vary with both the features of the visualization itself and people's backgrounds, specifically their visual literacy, familiarity with graphs and data, and educational and professional backgrounds. Does comprehension reflect the salient statistics and patterns that emerge organically from a particular combination of data and design?
Related Papers
Design Optimization & Interactive Data Exploration
Our research focuses on optimizing visualization design to enhance user performance on specific analytical tasks, particularly for clustering and pattern identification across various visualization types. We develop frameworks for creating visualizations that are optimized for both tasks and design constraints, moving beyond one-size-fits-all approaches. Our work includes automatic optimization algorithms that determine ideal visualization configurations for identifying patterns in multivariate datasets, spanning from scatterplots to network diagrams, heatmaps, and other complex visual representations. These frameworks help balance competing design goals while providing interactive exploration capabilities that adapt to different analytical needs. By systematically approaching design optimization across the visualization spectrum, we enable more effective data communication and improve user performance in complex analytical scenarios.