Do You See What I See? A Qualitative Study Eliciting High-Level Visualization Comprehension
Abstract
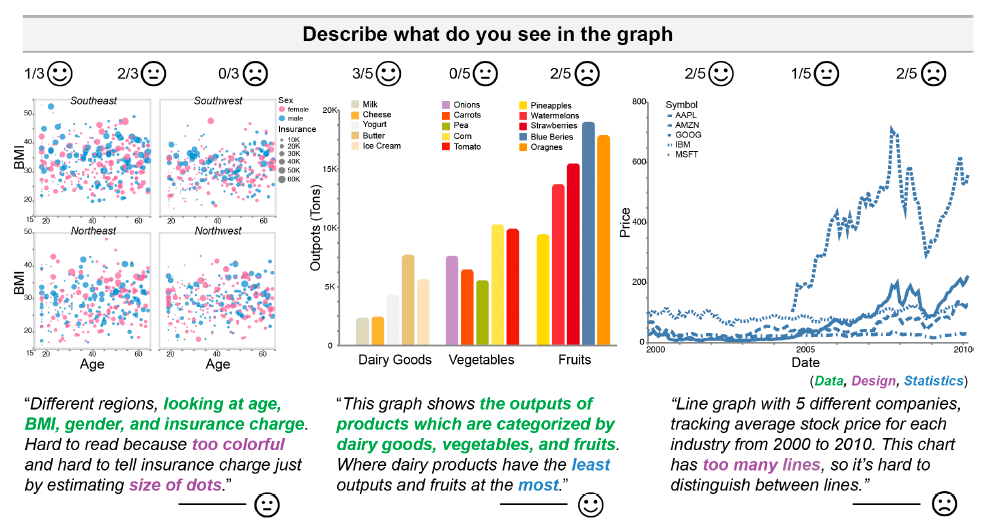
Designers often create visualizations to achieve specific high-level analytical or communication goals. These goals require people to naturally extract complex, contextualized, and interconnected patterns in data. While limited prior work has studied general high-level interpretation, prevailing perceptual studies of visualization effectiveness primarily focus on isolated, predefined, low-level tasks, such as estimating statistical quantities. This study more holistically explores visualization interpretation to examine the alignment between designers’ communicative goals and what their audience sees in a visualization, which we refer to as their comprehension. We found that statistics people effectively estimate from visualizations in classical graphical perception studies may differ from the patterns people intuitively comprehend in a visualization. We conducted a qualitative study on three types of visualizations—line graphs, bar graphs, and scatterplots—to investigate the high-level patterns people naturally draw from a visualization. Participants described a series of graphs using natural language and think-aloud protocols. We found that comprehension varies with a range of factors, including graph complexity and data distribution. Specifically, 1) a visualization’s stated objective often does not align with people’s comprehension, 2) results from traditional experiments may not predict the knowledge people build with a graph, and 3) chart type alone is insufficient to predict the information people extract from a graph. Our study confirms the importance of defining visualization effectiveness from multiple perspectives to assess and inform visualization practices.
Resources
 PDF
PDFCitation
@inproceedings{10.1145/3613904.3642813,
author = {Quadri, Ghulam Jilani and Wang, Arran Zeyu and Wang, Zhehao and Adorno, Jennifer and Rosen, Paul and Szafir, Danielle Albers},
title = {Do You See What I See? A Qualitative Study Eliciting High-Level Visualization Comprehension},
year = {2024},
isbn = {9798400703300},
publisher = {Association for Computing Machinery},
address = {New York, NY, USA},
url = {https://doi.org/10.1145/3613904.3642813},
doi = {10.1145/3613904.3642813},
abstract = {Designers often create visualizations to achieve specific high-level analytical or communication goals. These goals require people to naturally extract complex, contextualized, and interconnected patterns in data. While limited prior work has studied general high-level interpretation, prevailing perceptual studies of visualization effectiveness primarily focus on isolated, predefined, low-level tasks, such as estimating statistical quantities. This study more holistically explores visualization interpretation to examine the alignment between designers’ communicative goals and what their audience sees in a visualization, which we refer to as their comprehension. We found that statistics people effectively estimate from visualizations in classical graphical perception studies may differ from the patterns people intuitively comprehend in a visualization. We conducted a qualitative study on three types of visualizations—line graphs, bar graphs, and scatterplots—to investigate the high-level patterns people naturally draw from a visualization. Participants described a series of graphs using natural language and think-aloud protocols. We found that comprehension varies with a range of factors, including graph complexity and data distribution. Specifically, 1) a visualization’s stated objective often does not align with people’s comprehension, 2) results from traditional experiments may not predict the knowledge people build with a graph, and 3) chart type alone is insufficient to predict the information people extract from a graph. Our study confirms the importance of defining visualization effectiveness from multiple perspectives to assess and inform visualization practices.},
booktitle = {Proceedings of the 2024 CHI Conference on Human Factors in Computing Systems},
articleno = {204},
numpages = {26},
keywords = {Communicative goals, High-level comprehension, Insight, Qualitative evaluation, Visualization},
location = {Honolulu, HI, USA},
series = {CHI '24}
}